Wednesday, December 16, 2015

Reporting logged parameter values

During the past few years, I have had - and still have - the privilege to administer one of the largest IBM Cognos BI 10.2.1 configurations in The Netherlands. The production configuration consists of 2 webserver/gateways servers, 10 dispatcher servers and 2 (active/passive) content manager servers. Each day, approximately 80,000 reports are requested and processed. Each month the system serves approx. 6,000 unique users. Substantial growth is anticipated.

One of the security requirements, as demanded by the client, is to log all report and job requests. This is achieved by enabling the out-of-the-box Cognos Audit Logging to a database (Oracle). See the BI Administration and Security Guide, Chapter 5, for more information on this topic.

In addition, my client not only wants to see who has run which report, but also which parameter (or prompt) values were used when running these reports. To enable parameter value logging, we added the Advanced setting “RSVP.PARAMETERS.LOG” value “TRUE” in Cognos Administration for the ReportService and BatchReportService of each requested dispatcher. This setting populates the Audit log table COGIPF_PARAMETER with records containing COGIPF_TARGET_TYPE = 'JobStepDefinition' (for job step request parameter values) or COGIPF_PARAMETER_NAME = 'parameterValues' (for report request parameter values). Note: this setting is not well known or documented! We found and applied the information from this IBM document.

After enabling parameter value logging, for report requests all parameter value information is stored in a CLOB column named COGIPF_PARAMETER_VALUE_BLOB. As you might have guessed, this is XML type information.

Now the challenge is: how to elegantly retrieve this information for presenting in our audit report?

We solved this puzzle by defining some XML functions this native SQL query in Report Studio:
select
       "t"."COGIPF_REQUESTID"       "REQUEST_ID"      ,
       "t"."COGIPF_SUBREQUESTID"    "SUBREQUEST_ID"   ,
       "t"."COGIPF_TARGET_TYPE"     "TARGET_TYPE"     ,
       "t"."COGIPF_PARAMETER_NAME"  "PARAMETER_NAME"  ,
       "t"."COGIPF_PARAMETER_VALUE" "PARAMETER_VALUE" ,
       a.*
from
       COGIPF_PARAMETER "t",
       xmltable(
             xmlnamespaces('http://developer.cognos.com/schemas/bibus/3/' as "bus"),
             '/parameterValues/item/bus:value/item/bus:use'
             passing xmltype(
                    --substitute missing XML by some empty XML to avoid syntax errors
                    case when length(cogipf_parameter_value_blob) > 0
                           then cogipf_parameter_value_blob
                           else to_clob('') end)
             columns
                    naam            varchar (250)   path './../../../bus:name',
                    usevalue        varchar(2500)   path '.' ,
                    displayvalue    varchar(2500)   path './../bus:display'  ) a

Explanation regarding the XML “path” as used in the column definitions above:
  • the node “bus:use” is the referral point, as mentioned in '/parameterValues/item/bus:value/item/bus:use'
  • column “naam” (Dutch for “name”) is retrieved from three levels up
  • column “usevalue” is at the referral level
  • column dispayvalue is at the same level, adjacent node

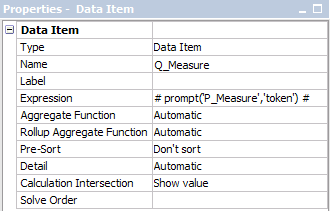
Next step is to feed it to a normal query, here it's named Query2:

Query2 contains the filter on JobStepDefinition and parameterValues (this could alternatively have been defined in the native query as well):

The filter on REQUEST_ID gets its parameter ?parRequestId? passed by an overview report drilling through to this parameter report.
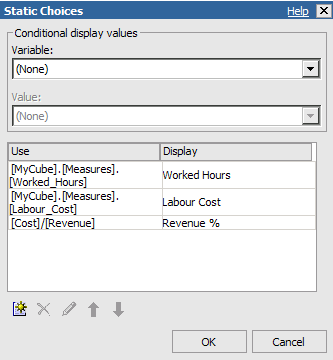
The result is presented in a normal list object, containing the following columns and values per logged parameter:

Using this type of native query was key to extract the information we need in our log reports.

Please let me know in the comments below if this information was of any value to you!

PS Kudos to co-worker Fred Bouwhuis for sorting this technique out!


Wednesday, February 10, 2010

Contextual Analysis Reports

In my previous post, I've explained the technique for interactive measure reports. The user could change the measure displayed in the chart and crosstab simply by a click on the radio button list. Below this list a drill through link "Go to Analysis Report" was displayed.

Actually, the reporting solution for this customer consisted of several dashboard reports, one for each type of manager. Each dashboard shows up to 6 charts (one per KPI). Clicking on a chart runs a KPI report like you've seen in the prevous post, containing the button list of measures as well as the "Go to Analysis Report" link. Clicking on this link runs a commonly defined Analysis Report.

Features of the Contextual Analysis Report


The Analysis Report:
  • is a generic Report Studio type report called from every specific KPI-report
  • receives the specific KPI value as a parameter value
  • was developed to deliver basic analysis capabilities to the manager, licensed for not more than the Consumer role
  • displayes a crosstab specified by the user
  • features limited row and column selection options, including filtering
  • offers only the dimensions and measures relevant to the passed KPI, thus being "Contextual"

This report enables the manager (a Cognos Consumer user) to perform some analysis on his business performance without having to use Analysis Studio. This not only reduces the TCO (because no Business Analyst license is needed), but it also relieves the burden of having to learn another user interface with more functionality than strictly needed.

In this project, 30 KPI's were developed. All of these were included in the Measure Dimension Matrix. Each KPI related to one group of measures (resulting in about 120 measures including regular and calculated measures). However, not each measure group relates to a dimension. So it was a rather mixed matrix with moderate scarcity (i.e. empty cells). (Besides that, not all related measures were bound to the same lowest level of any dimension. This is however neatly resolved by scoping the dimension levels in Cognos Transformer.)

The Analysis Report looks like this. It's an example of KPI01 having 6 dimensions related to it. Mind that the total Multi Dimensional Model (MDM) consists of 25 dimensions and 30 KPI's. Using render variables each KPI-parameter is evaluated and the relevant prompt is shown or hidden. Note also that so many dimensions and measures in the model will make this a heavy report, as it will contain a lot of code!


So the report opens up with the prompt page offering prompts for selection of:
  • a primary and secondary dimension to be displayed in the outer and inner rows of the crosstab (only the dimensions related to the KPI!)
  • a measure within the group of measures the specific KPI represents
  • a period of time to be displayed in the columns of the crosstab
  • additional filtering (optional) of items of the related dimensions

When the user finishes the prompt pages, the report runs resulting in a crosstab. The prompts are shown in the top half of the report page itself for immediate adaption by the user (Auto-submit).


Toggling of Tree Prompts
Aside from the contextual features of this report, a technique has been applied to toggle display of the optional prompts.

The optional filter prompts in both the prompt page and the report page are Tree Prompt objects. They appear as soon as the user clicks a dimension. Here, some HTML Items containing JavaScript code, <a> and <div> tags are used to toggle display of the prompts.


These items are:
1. at the start of the page, an HTML Item containing the code:
 <script language="javascript" type="text/javascript">
  function toggleDiv(divId) {
    var theDiv = document.getElementById(divId);
    if (theDiv != null) {
      var divStyle = theDiv.style;
      divStyle.display = (divStyle.display == "none" ? "block" : "none");
    }
  }
</script>
2. before the dimension filter link, an HTML Item containing the code:
<a class="togglePrompt" href="javascript:toggleDiv('prompt_Product');">
3. after the link and before the tree prompt, two HTML Items containing the code:
</a>

<div id="prompt_Product" style="display:none;">
4. after the tree prompt, an HTML Item containing the code:
</div>

It looks like this for each dimension filter:

Well, I hope this may be of any use to you. In case of any questions or so, please drop a comment below and I'll follow up.

Wednesday, February 3, 2010

Interactive measure reports

Last year one of my customers would like to have a Cognos BI report having an in-report prompt on the measure to be shown in a combination chart in HTML-format. Something like this:
The chart currently shows the number of Worked Hours, a measure that is selected in the radio button list on the left hand of the chart. When the user clicks another measure, the chart directly shows that measure, without further prompting.

In this post I will show how this has been developed. 

Some notes first:
  • This report is created in Cognos 8v4 BI, using Report Studio.
  • The data source is a PowerCube, so some dimensional authoring is done in the report (using MUN's et cetera). This not relevant though, because I think the technique should also work with relational authoring.

Create a value prompt

First, create a Value Prompt object from the toolbox, and set it to:
  • Required: "Yes"
  • Multi-Select: "No"
  • UI: "Radio button group"
  • Auto-Submit: "Yes" (important, otherwise the report will not automatically be rerun):
In the Static Choices property of the Value Prompt object, enter the values to use (i.e. the measure MUN's) and to display in the radio button group:

In the Default Selections property of the Value Prompt object, enter the value to use when the report is run for the first time, so no prompt page appears:
So now the prompt object is finished.

Create a query item to refer to the prompt value

Next, the query used by the Chart object needs to contain an item that dynamically refers to the selected prompt value. Let's call this query item Q_Measure:

This item is defined in the query as a Data Item object, having these properties:
The Expression property contains the # prompt() # macro. This will read the value of parameter P_Measure (as defined in the Value Prompt object), and applies this value an item (the so-called 'token'). In this case, the specified MUN value is used to display the according cube measure in the chart.

In general, this is a very powerful function you could use in many cases to create powerful reports. You are however limited to strings in the expression provided entirely by the macro function, because the macro function cannot be combined with other non-macro functions. See the Report Studio Professional Authoring User Guide for more information on macros and expressions.


Oh, and did you wonder what the link "Go to Analysis Report" was about in the report example above? Check out one of my next posts to come, about Contextual Analysis...

Friday, April 3, 2009

Bridge analysis of changes

It's been a while since my last post, but hey, I'll only post interesting experiences with Cognos BI here... If you'd like to check my other Internet activity you can always go to http://mavawa.com ;)

Recently, I've been in close development with one of my Cognos customers to create a flexible and simple report for analysis of changes in prospect forecasting, called Bridge Analysis. Unfortunately, I cannot share a complete example of this report with you (because of company confidentiality), as this would have a far better look, with logo's, category names and definitions, selected prompt values et cetera. On the other hand, this makes it much better to focus on the heart of the matter.

The Bridge Analysis report, developed in Cognos BI 8v3 Report Studio, contains:
  • a Prompt page to select starting snapshot (first pillar or the bridge), ending snapshot (usually the running forecast, as last pillar of the bridge), and various other value prompts for filtering on prospect characteristics
  • the Bridge page showing a cumulative column chart (see below) with first and last pillar, and various change categories in between
  • Legend page explaining the used categories containing dynamic descriptions (query items)
  • a Page group for all change categories, with one subsequent page displaying a list of top 10 prospect details in descending absolute order of change; the sum of changes in each prospect page totals into the bridge chart category column height, being positive (green) or negative (red)

Bridge Analysis

There are some tricks techniques used in this report:
  • The right side pillar is not a regular chart column, but is a Total column, enabled via the chart properties. I've used this on purpose, because a regular column would have to be calculated as a negative value in order to enable movement downwards to zero on the Y-axis. If I had used a regular column to show the right side pillar, this would have resulted in a negative value notation on top of the column, and the column color would have been red. A Total column on the other hand, has it's own color defined (green, as well as the starting column). This rightfully reflects the total prospect values to be analyzed.
  • Allthough multiple queries are used, the entire report is using one common prospect details query, delivering all relevant columns in one row per prospect. Other queries are defined on top of this detail query.
  • A drill through has been defined in the Change Category column, to show the respective prospect list for the selected category.
  • Change categories having no prospect value are excluded from the report, so only relevant categories are displayed in both the bridge chart and in the subsequent categories page group.

My customer is now happy to be able to easily present changed data in this very useful way, and I'm happy to be able to help him creating this powerful and flexible Cognos report :-)

Tuesday, April 15, 2008

Commenting on your report data


Sometimes users ask me if it's possible to add comments to their report data, in order to clarify its status. Just as simple as possible, without having to use another application.

Using Cognos BI, this certainly is possible. In this post I want to show you a technique I have developed using the Great Outdoors demo environment.

In summary these are the steps, implementing a commentary update application:
1. In the database, create a Stored Procedure, allowing you to update the comment column in a table record.
2. In the Cognos Framework, create a Query Subject using this stored procedure.
3. Create a prompt report prompting for the comment in a prompt page, and showing the modified comment in the report page.
4. In the list report, add a drill through to the prompt report, passing the selection values.


1. Stored procedure

The stored procedure could look like this:
CREATE PROCEDURE SalesTargetCommentAdd @intYear smallint, @strPRODUCT nvarchar (50), @strComment nvarchar(2048)

AS

IF rtrim(@strComment) = ''
UPDATE SALES_TARGET_COMMENT
SET Comment = NULL
WHERE [YEAR]=@intYear and PRODUCT=@strPRODUCT
ELSE
IF EXISTS (SELECT * FROM SALES_TARGET_COMMENT WHERE [YEAR]=@intYear and PRODUCT=@strPRODUCT)
UPDATE SALES_TARGET_COMMENT
SET Comment = @strComment
WHERE [YEAR]=@intYear and PRODUCT=@strPRODUCT
ELSE
INSERT INTO SALES_TARGET_COMMENT ([YEAR], PRODUCT, COMMENT)
VALUES (@intYear, @strPRODUCT, @strComment)

SELECT [YEAR], PRODUCT, Comment
FROM SALES_TARGET_COMMENT
WHERE [YEAR]=@intYear and PRODUCT=@strPRODUCT
GO


Mind that the database user used in the Cognos data store Connection must have execute privilege on the stored procedure and update privilege on the table!

2. Framework Manager Query Subject

The Framework Manager Query Subject contains the store procedure and the parameters:


3. The prompt report

The prompt report shows in the prompt page the current comment (using a normal query subject) and prompts for the new comment using a textbox prompt object:


The report page shows the comment item from the stored procedure query subject:


The HTML item has this a-tag code to close the window on click:
href="javascript: self.close ()"


4. The list report

The list report shows data from the normal query subject and contains a text item object called "update" in the list frame next to the comment item, with a drill down to the prompt report:


Wednesday, July 25, 2007

Cognos 8 College Dashboard

Here's another example of a dashboard (or should I rather call it a scorecard?), developed by me using a Cognos 8 dimensionally modeled framework and Report Studio.

It is used by the management of an educational center to easily and quickly view the current status of the key performance indicators of the organization. Of course, the numbers used in this picture are entirely fictitious (albeit not unrealistic!).


Feature highlights:
  • The framework consists of multiple dimensionally modeled star schema's, each with it's own regular dimensions. Common regular dimensions (i.e. the organization dimension) are related through relationships from each fact query subject to one central organization query subject.
  • The report makes use of multiple master-detail relationships. The organization dimension is used in the master query, and is linked to each organization level query item in the detail query. In the report example, most columns displayed are from separate detail lists. So the master query delivers the drill down capability through the organization, and the detail queries deliver the indicator information.
  • Coloring of the indicators is done by using conditional style variables.
  • When the mouse cursor is on one of the blue indicator names, a blue popup tooltip window appears containing both dynamic and static information. This is built by creating a report expression in an HTML item. The HTML item is an anchor tag <a> using the onmouseover attribute and some JavaScript code. Many thanks to Walter Zorn for sharing this piece of JavaScript! The report expression looks like this:

'<a onmouseover="Tip(''Uitval ' + [Detail Deelnemers BO uitstroom].[Schooljaar o.b.v. Specfieke peildatum] + '. Definitie: Aantal schoolverlaters zonder diploma / Aantal BO uitstromers. Als het percentage minder dan 33,3% is, dan is de kleur groen. Als het percentage tussen 33,3% en 50% is, dan is de kleur oranje. Als het percentage 50% of meer is, dan is de kleur rood.'')">Uitval</a>'

Wednesday, May 30, 2007

Forum 2007

Here are some Key Learnings from the Cognos Forum 2007 (Orlando FL). I have attended this user conference together with Hugo (my colleague) and 3,005 other attendees. Learned a lot from tips and techniques during the intensive sessions and presentations from end user organizations, Cognos and partners.

Wednesday, March 28, 2007

Cognos 8 Dashboard project

In this post, I'd like to share my implementation of a Cognos 8 Dashboard application with you.

This dashboard application shows several Gauges and Charts, displayed both one Gauge and one Chart per page (see beelow) and several Gauges on a row (cockpit look):

One remark here: the Gauge Palette values indicating the red-to-orange and orange-to-green borders, are not dynamic but must be entered as static values in the report. This is annoying as these values are changing every year.

Filtering
The application also offers filtering possibilities for the most common dimensions. These filters are not built in the prompt page but in the first page and also below the charts and graphs, so it's easy for users to filter what they want in a compound and multi-level way using a tree prompt for each common dimension:

PowerPlay cube
The data is queried from a single PowerPlay cube, so dimension sharing among the measures is guaranteed! I've chosen to create a PowerCube for this application in order to speed up quering (as data is already stored as aggregates in the cube, this should be performed really fast). The PowerCube is created as just simple data source of type PowerCube in Cognos 8, and this data source connection is all what's needed to publish the Package from Framework Manager.

Transformer model
The PowerPlay Transformer model looks like this:

The table queries are stored in a data warehouse database and are designed really simple (star schema design), so manual SQL queries have been used here as feeders to each Transformer model data source.

There's just one drawback using this PowerCube data source approach. You can only refresh the PowerCube file when there's no connection to it. This means that either
  • the Cognos 8 service must be stopped entirely (which should be no problem outside office hours), or
  • the cubeswap script must be executed, which alters the data source connection to another cube file (see <Cognos 8 install location>webappsutilitiescubeSwap)

I'm really looking forward to see PowerPlay's Transformer OLAP designing and cube creating technology being integrated with Cognos 8 Framework Manager, as this would further reduce Cognos tool complexity. Although it's currently not really complex in comparison to Business Objects...

Final navigation path implementation

As it appeared to be impossible to implement a navigation path the way I wanted to (using the browser's history back function, see my previous post), I've decided to create a limited but robust alternative using the javascript exit function. It's limitation is that the user can only junp back to the previous page (report), and not to pages higher (more to the left) in the path.
Therefore I've created a piece of javascript code just for the last entry in the navigation path, and created a hyperlink only for this entry ('Marap' is the name of the previous page):

<a href="javascript:exit()">Marap</a>


Of course, the user is always able to use the browser history to go back to prior pages by clicking on the Go Back drop down button in the browser's navigation toolbar!

Tuesday, January 30, 2007

Implementing a navigation path

The Dashboard application, as of I blogged before, contains a navigation path ('kruimelpad' in Dutch).

The navigation path is a series of one or more hyperlinks showing the path of reports a user has run from the Portal via the Dashboard down to the Monthly reports ('Marap') and the Trend graph reports.

The path is presented as one line in the top of the report and looks like this:


Each hyperlink in the navigation path consists of an HTML item object in the report. The '>' signs are just text item objects.

The HTML item contains an anchor tag calling the browser's page history and skipping a number of pages back.

For instance the link to 'Marap' looks like this, calling the history two pages back (-2):

<a href="#" onclick="history.go(-2);return false;">Marap</a>

Why two pages back and not one? Well, when Cognos executes a report, it will show an intermediate page "Your report is running." as long as the report is not ready and you're waiting for it. This page needs to be skipped when navigating back, so I don't go back one page but two.

In case of the prior run reports 'Integraal dashboard' and 'Portal', the same code is used, but instead of -2, the number of pages back is -4 and -6 respectively.

The main drawback of this technique is that Cognos does not show this page when the report can be run very quickly, so in that case the history call should be only one page back. For this potential issue, I have not found a solution yet.

I don't want the report to be re-run, as this is not user friendly in my opinion. By the way, a re-execution of the prior report would be possible using the following code:

<script language="javascript">
function exit()
{
document.formWarpRequest.method.value = 'release';
document.formWarpRequest.m.value = 'portal/report-viewer-release.xts';
setTimeout("document.formWarpRequest.submit()", 1);
}
</script>
<a class="ccOptions" href="javascript:exit()">Marap</a>

If someone knows of a way to elimininate the intermediate "Your report is running." page, please let me know! Cognos offers no solution for this as fas as I know.